Dashboard tour
The dashboard is the main way operators work with SPOT. This page walks through what each section is for, what an operator typically looks at, and how to find a specific analysis or email when something needs investigating.
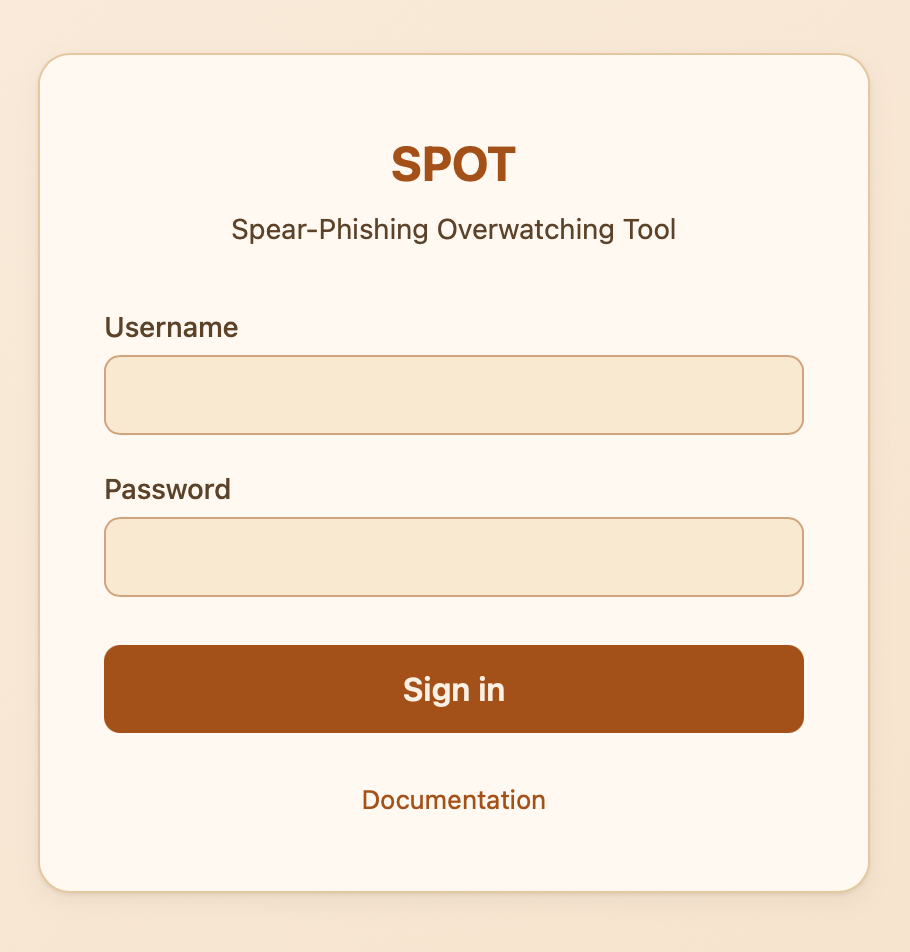
Logging in
The first screen is a login form. The administrator who installed SPOT created the first account; once logged in, the operator can create more accounts from the Users page (admin only). Every operator has one of three roles:
- Viewer ; can browse analyses, emails, workflows, and the knowledge store, but cannot change anything.
- Analyst ; can submit analyses, manage workflows, and act on results.
- Admin ; additionally manages users, plugins, and platform configuration.
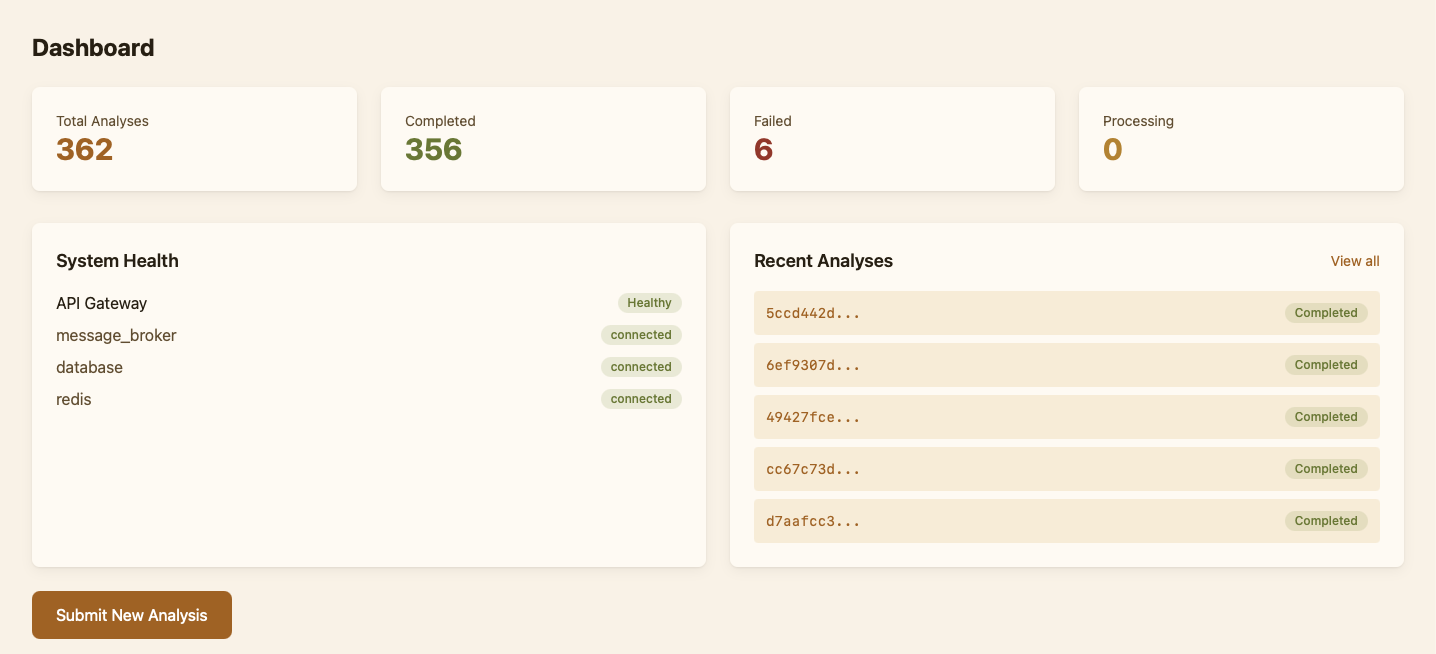
The home dashboard
The home page is a summary: how many analyses ran in the last 24 hours, how many of them were flagged, the recent verdict mix, and the platform's health indicators (services up, queue lengths, last ingestion). It is meant for a quick check at the start of a shift — "is anything broken, is anything unusual?" ; rather than detailed work.
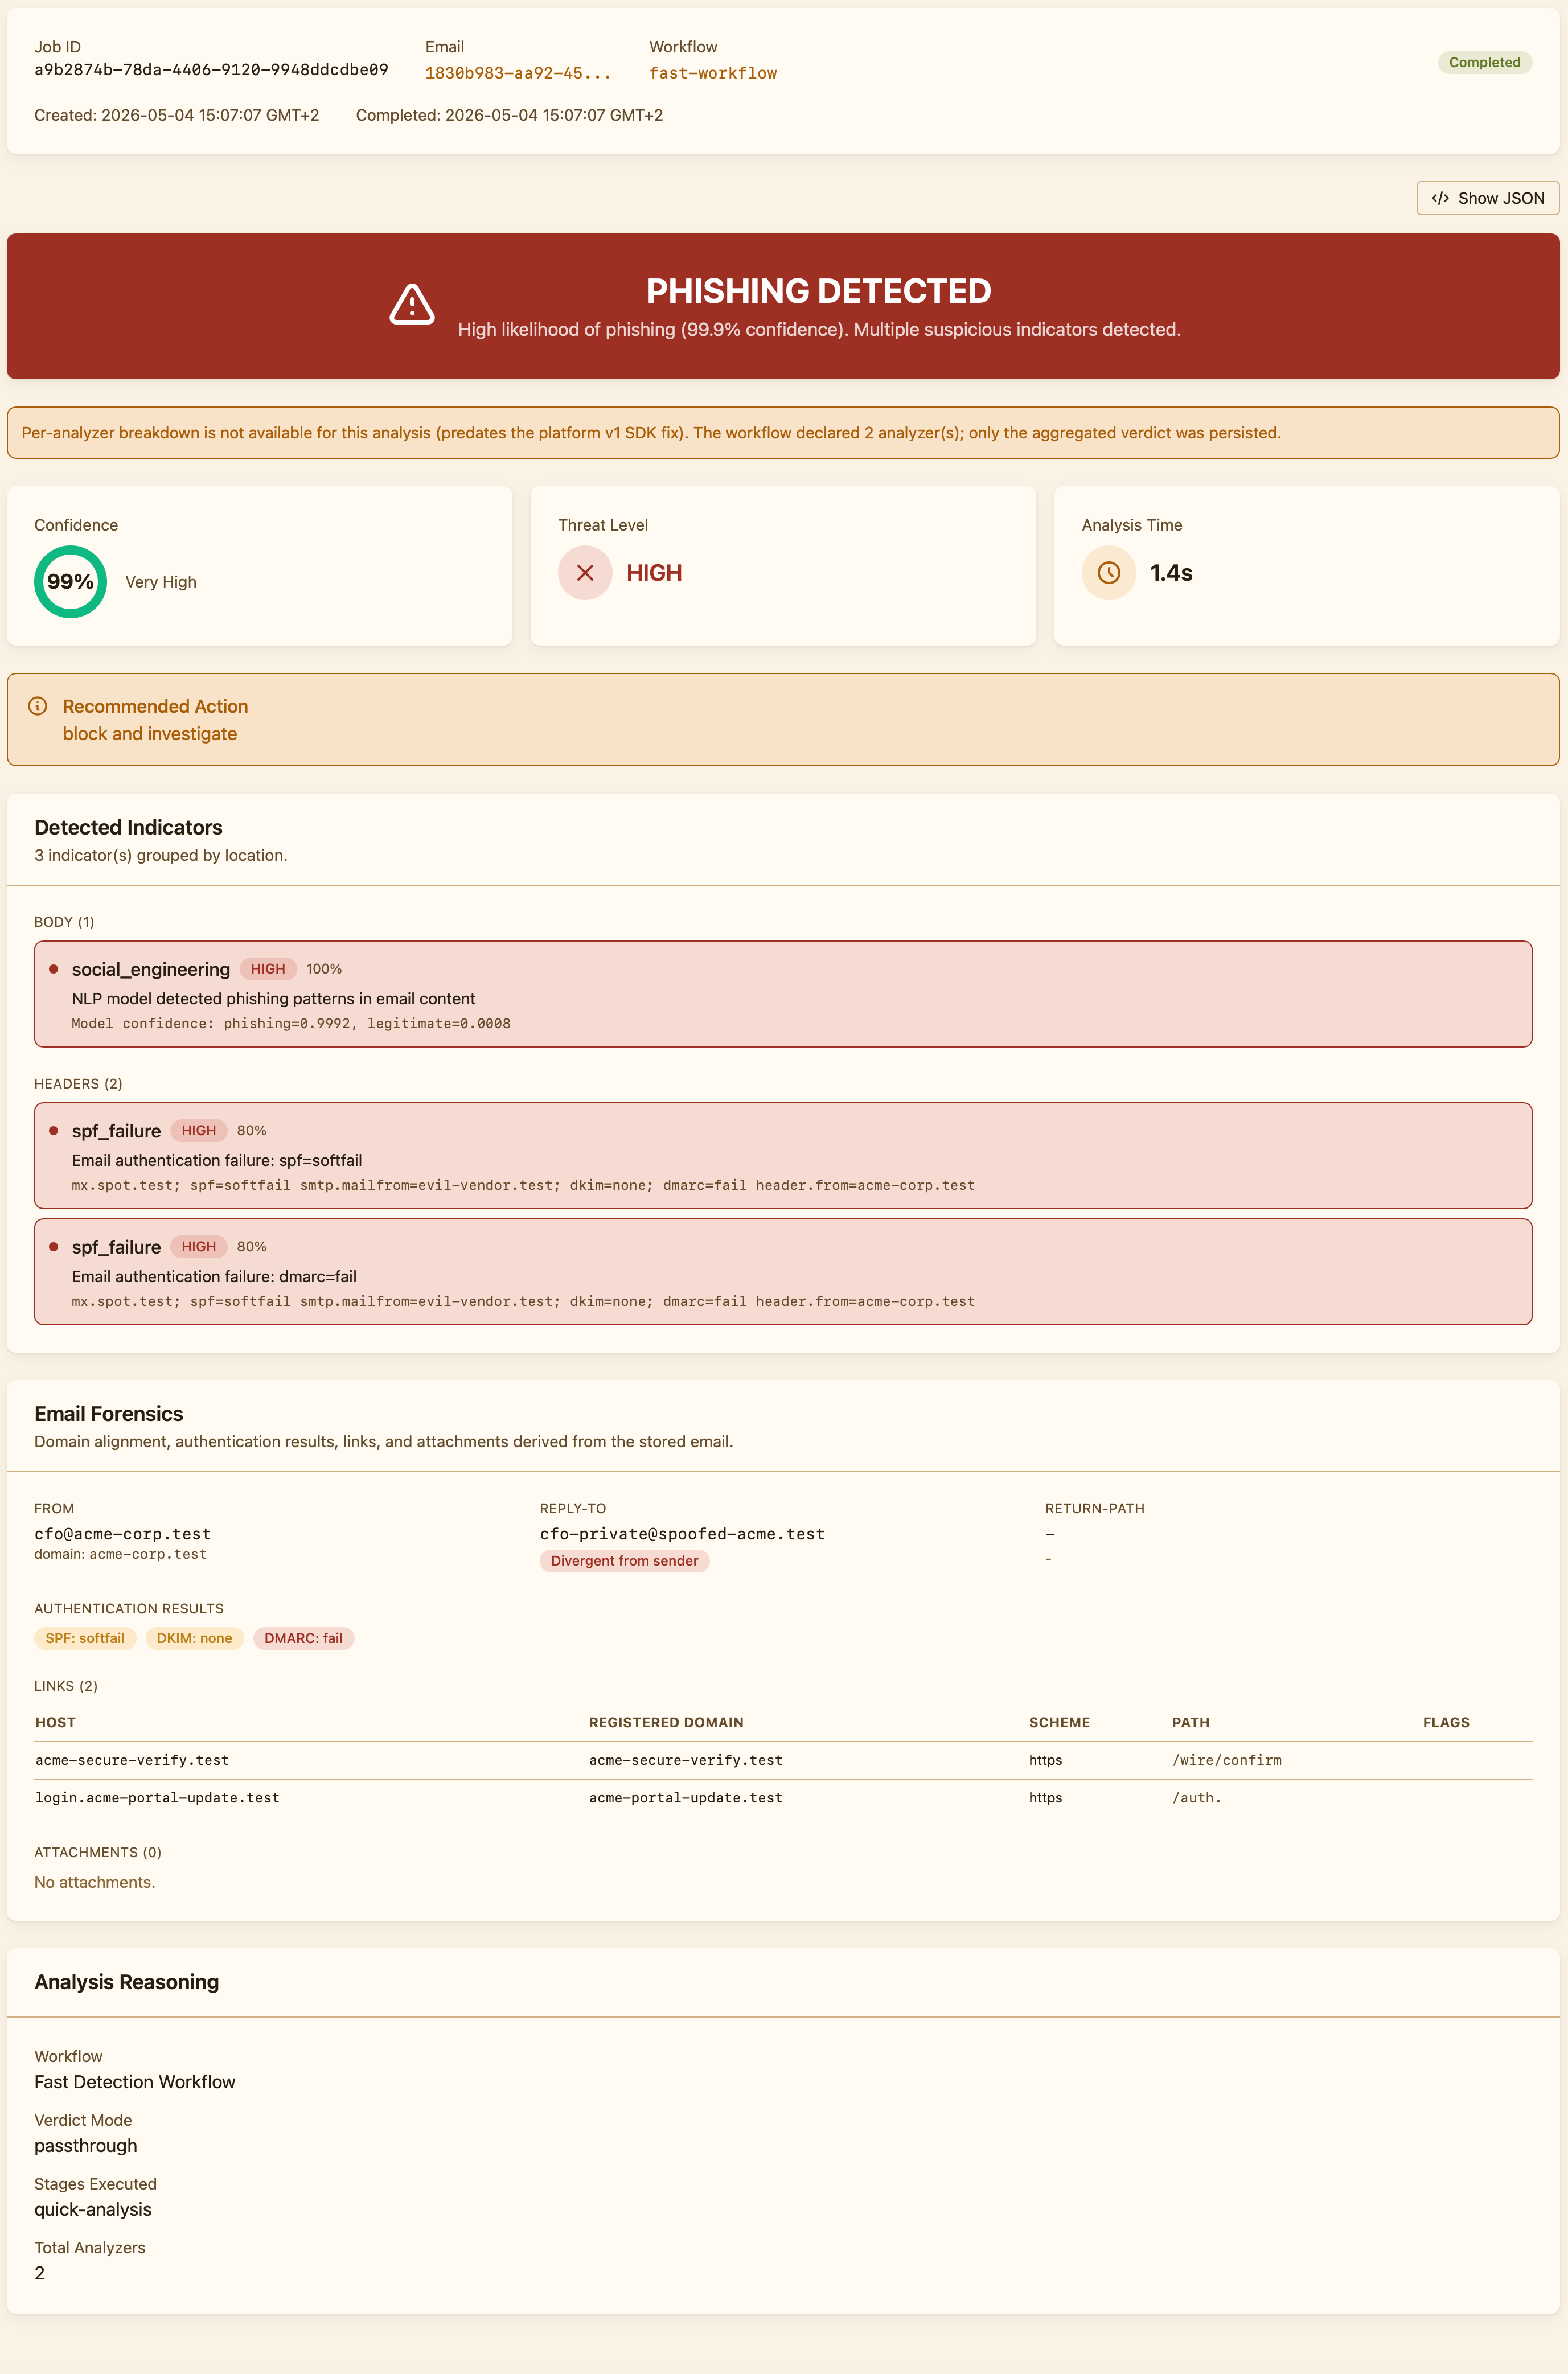
Working with analyses
The Analysis page is where operators spend most of their time. It lists every classification SPOT has produced, newest first, with the email's subject, the verdict, the threat level, and the workflow that produced it. Filters narrow the list to a status, a phishing/clean verdict, or a specific workflow.
Opening an analysis gives the full picture: the original email (decrypted on the fly), the platform verdict at the top, then a breakdown showing what each analyzer said, why, and which indicators contributed. When a stage failed because an analyzer timed out or errored, the dashboard surfaces that explicitly so the operator can tell the difference between "low confidence" and "did not actually run".
Operators can re-run an analysis on a different workflow without re-submitting the email. This is useful when investigating a missed detection ("would the strict workflow have caught this?") or calibrating a new policy.
Browsing emails
The Emails page lists every email SPOT has stored, regardless of how it arrived. Each row links to the analyses produced for that email ; usually one, but more if the message has been re-analysed under different workflows. Emails are stored encrypted; the dashboard decrypts them on demand and only when an authorised operator opens them.
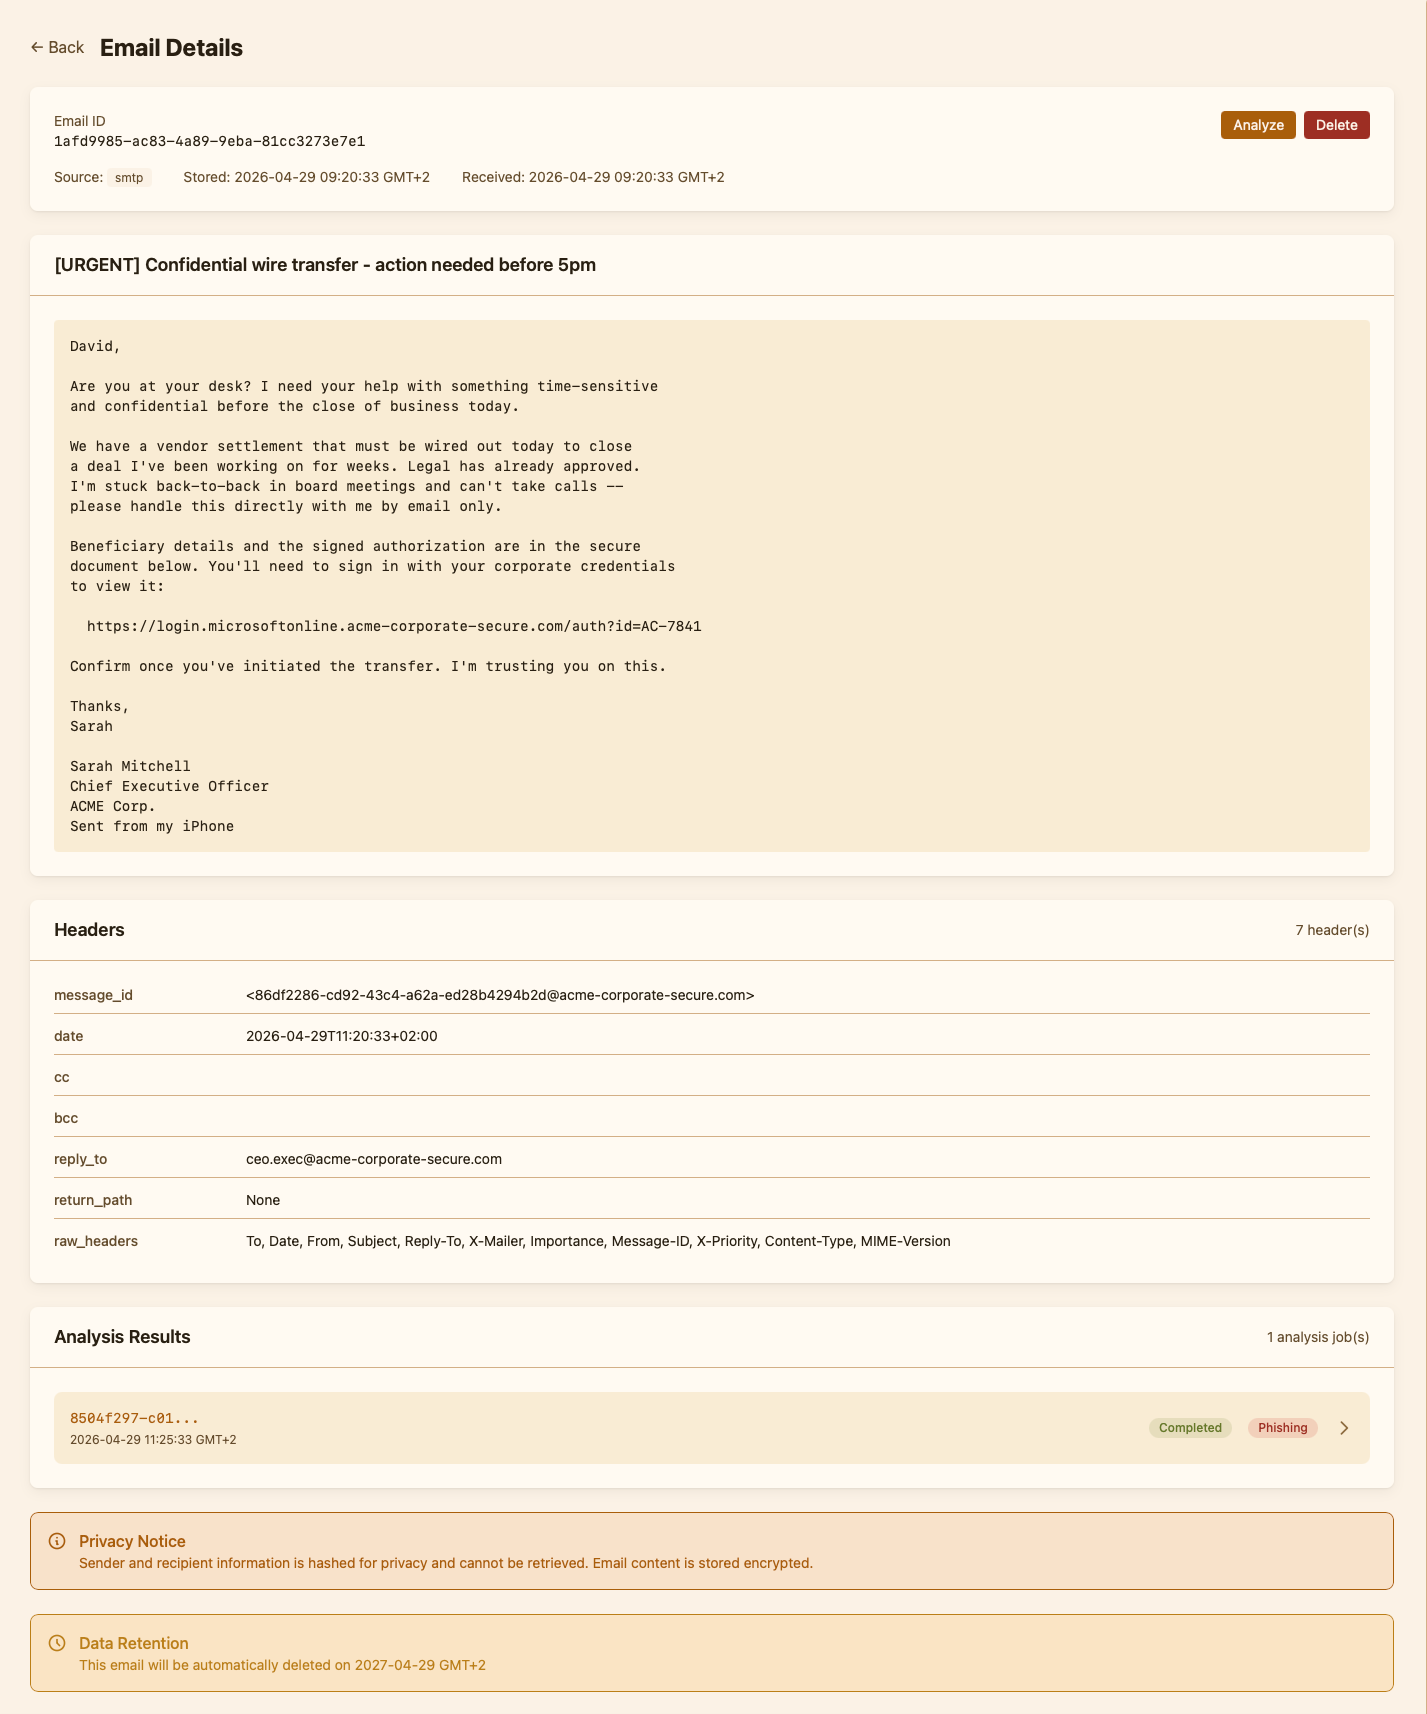
The email view also exposes raw forensic data: full headers, MIME structure, attachments, decoded URLs. This is the panel operators reach for during incident response when they need facts the analysis summary does not show.
Submitting an email manually
There is a Submit form for ad-hoc analysis. Operators paste an email (or upload an .eml file), pick a workflow, and SPOT analyses it as if it had arrived through a retriever. The result lands in the Analysis list immediately; the email is stored alongside the others. This is how operators test workflows on real-world samples and how they re-classify a forwarded report.
Workflows, plugins, knowledge
These three pages are where operators configure SPOT rather than work in it.
- Workflows shows the policies in this deployment, the default one, and the editor for cloning or adjusting them.
- Plugins shows what is installed, what is available in the catalog, and where each plugin came from.
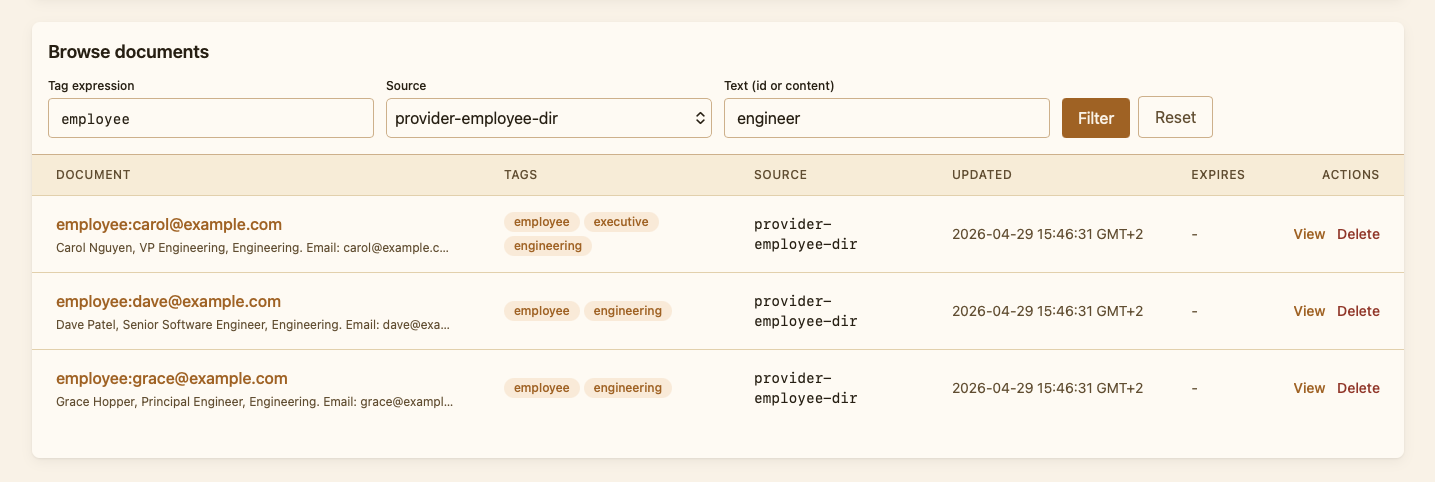
- Knowledge shows the consolidated store of organisational facts that context providers have deposited; operators can search it by tag and run the same kind of semantic query an analyzer would.
Health, queues, preferences
Three smaller pages help with operations rather than analysis:
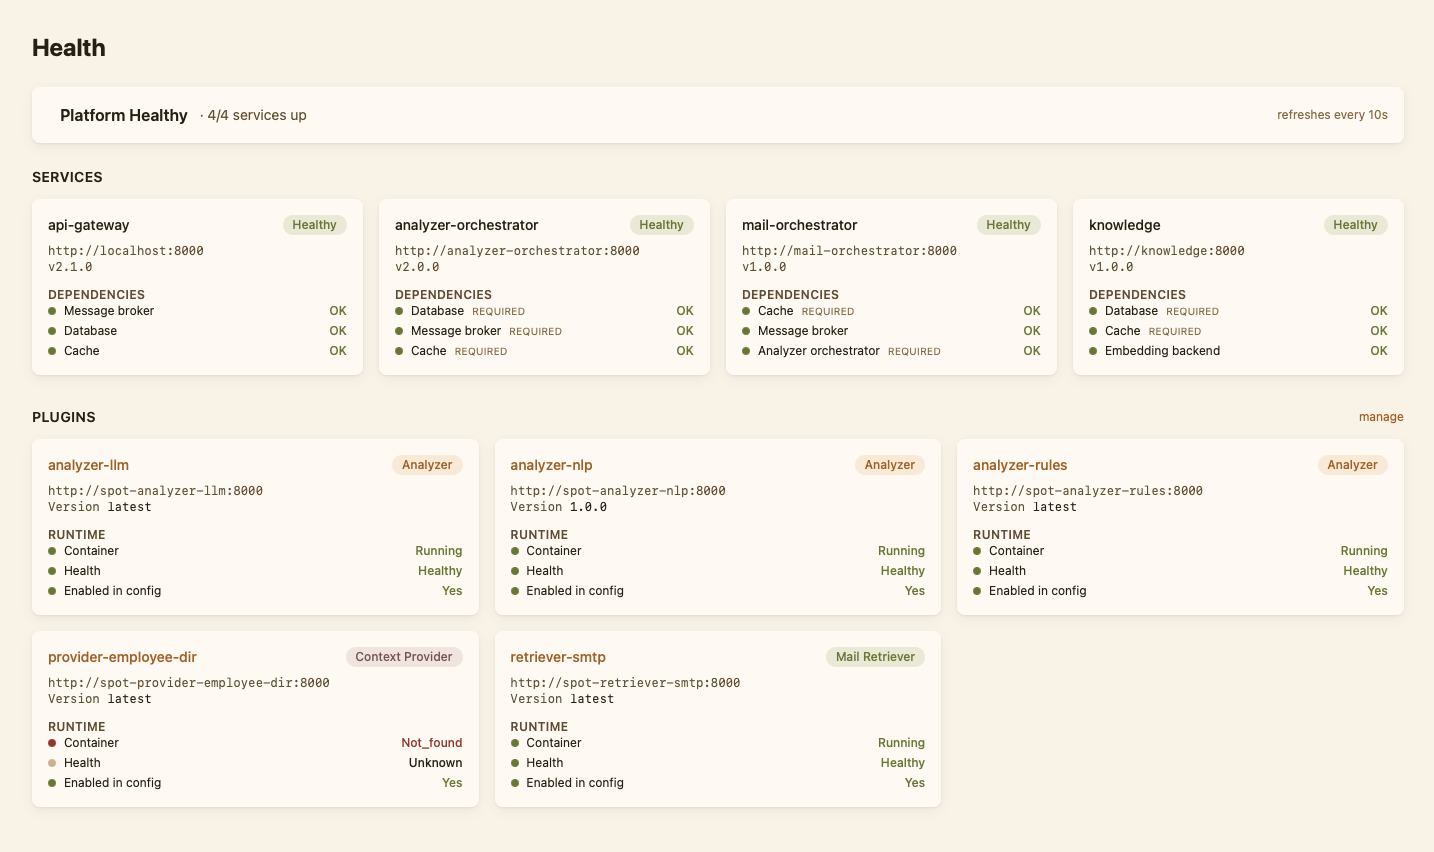
- Health shows the rollup of every SPOT service: API gateway, the orchestrators, the analyzers, the retrievers, the database, RabbitMQ. Each row is green when the service is reachable and responsive, red when it is not.
- Queues shows the live state of the message queues SPOT uses internally. Useful for spotting backlogs.
- Preferences lets each operator pick a timezone for date display. SPOT stores timestamps in UTC; the dashboard converts them on the fly using the browser's timezone by default, or any IANA zone the operator chooses.
Finding what you need
Three search and filter mechanisms cover most queries:
- The analysis filters (status, phishing/clean, workflow) at the top of the Analysis page.
- The email search at the top of the Emails page, which matches subject, sender, and recipient.
- The knowledge search at the top of the Knowledge page, which takes a free-text query and a tag expression.
Direct links to a specific analysis (/analysis/{id}) or email (/emails/{id}) are stable, so an operator can paste them into a ticket or chat thread and the recipient lands on the same view.