Operator guide
This guide is for the people who use SPOT day to day: triaging flagged messages, running ad-hoc analyses, tuning workflows, keeping an eye on the platform's health. It assumes SPOT is already running and you have an account; the platform-side setup guides (Quickstart and Admin guide) live in the Platform section of the merged documentation site.
For an introduction to what SPOT does and how it works, the Platform → Concepts section explains the underlying ideas (how SPOT works end-to-end, plugins, workflows, the knowledge store). The Dashboard tour sits next to this guide and walks through every page the operator works in.
The rest of this page is the operator's playbook for the recurring situations.
Reviewing a flagged email
When a message gets flagged, the goal is not just to confirm or reject the verdict ; it is to understand why SPOT made the call, so the operator can either trust it or fix the policy. The path through the dashboard is always the same:
- Open the analysis from the Analysis page.
- Read the verdict header: phishing yes/no, threat level, confidence, recommended action.
- Scan the per-analyzer breakdown. Each analyzer tells you what it saw and how confident it was.
- Look at the indicators. They are the concrete signals that drove the decision ; a domain that looks like a known one, a URL that matches a feed, a tone of urgency that the language model noticed.
- If something is unclear, open the email itself and read it.
flowchart TB
    Start([Open the analysis<br/>from /analysis])
    Verdict[Read the verdict header<br/>phishing yes/no · threat level<br/>confidence · recommended action]
    Breakdown[Scan the per-analyzer<br/>breakdown ; what each<br/>analyzer saw and how<br/>confident it was]
    Indicators[Inspect the indicators —<br/>concrete signals that drove<br/>the decision]
    Clear{Verdict<br/>understood?}
    Trust([Trust it or override<br/>via the workflow])
    Email([Open the email itself<br/>and re-read with context])

    Start --> Verdict --> Breakdown --> Indicators --> Clear
    Clear -->|yes| Trust
    Clear -->|no| Email
    Email --> Indicators
If the verdict is right but the recommended action is too lenient or too strict for the policy, that is a workflow change: open the workflow that produced the verdict and adjust the aggregation, the weights, or the threshold. If the verdict is wrong, the next question is which analyzer got it wrong: the breakdown tells you, and the analyzer's settings page is where you adjust it.
Re-running an analysis
Re-running is the right move when:
- A new analyzer has just been installed and you want it to look at a recent flagged message.
- A workflow has been changed and you want to know what it would have said about a past email.
- An analyzer was unreachable when the email first arrived and you want a clean run now that it is back.
Open the analysis, pick the workflow you want to use, and submit. SPOT runs the full pipeline against the stored email and writes a new analysis. The original is not modified ; both records remain side by side so the operator can compare them.
Searching for related emails
Two patterns cover almost every investigation:
- By sender or recipient. The Emails page filters on the envelope and header fields. Useful for "show me everything from this address in the last week" after spotting one suspicious message.
- By verdict over time. The Analysis page filters on workflow and phishing/clean. Useful for "did anything else trip the strict workflow today?" or "are we suddenly getting more flagged finance emails?".
The same filters work across the whole history, not just the current page. Bookmark the URL; it preserves the filters and is safe to share with another operator.
Adjusting a workflow
Every workflow change starts with the same question: what is the new policy supposed to do? "Be stricter" is not a policy; "give the LLM analyzer more weight when the email mentions wire transfers" is.
Once the desired change is clear, the dashboard makes it mechanical:
- Open the workflow on the Workflows page.
- Edit the stage where the analyzer in question lives, or add a new stage that runs only when the conditions you care about are met.
- Save. Validation runs automatically; if the change is invalid, SPOT explains why and refuses to commit.
- Test it. Use the workflow test against a few representative emails before promoting it to default.
A safer pattern: clone the existing default, edit the clone, test it, and only promote it to default once the test results match expectations. The original default stays available as a rollback.
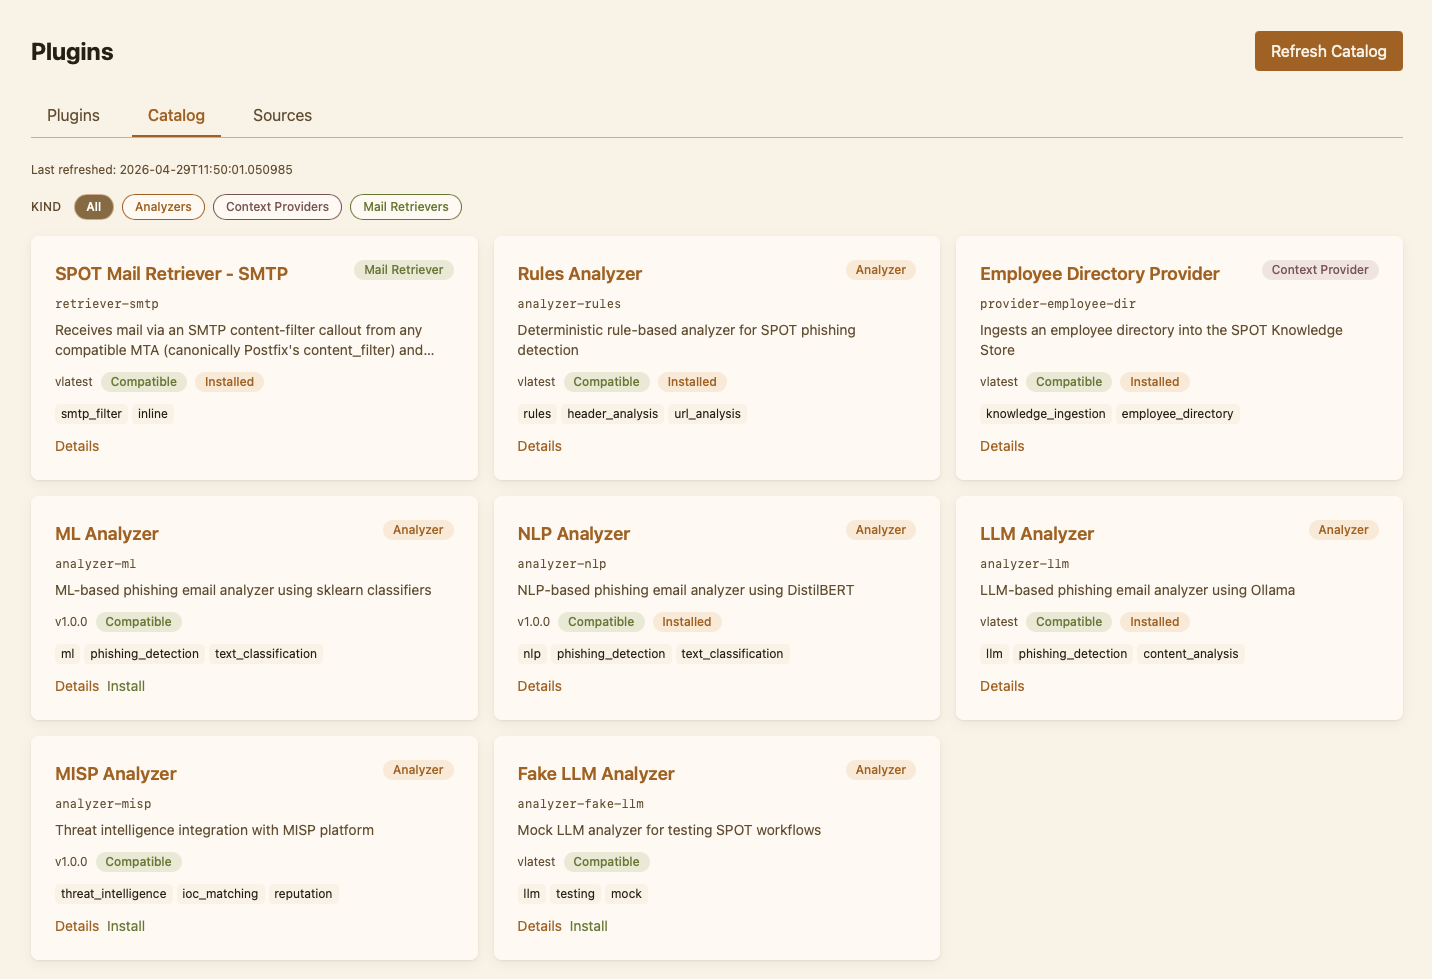
Installing or updating a plugin
The Plugins page has two views: the Installed tab shows what is currently running in this deployment, and the Catalog tab shows what is available from the configured sources.
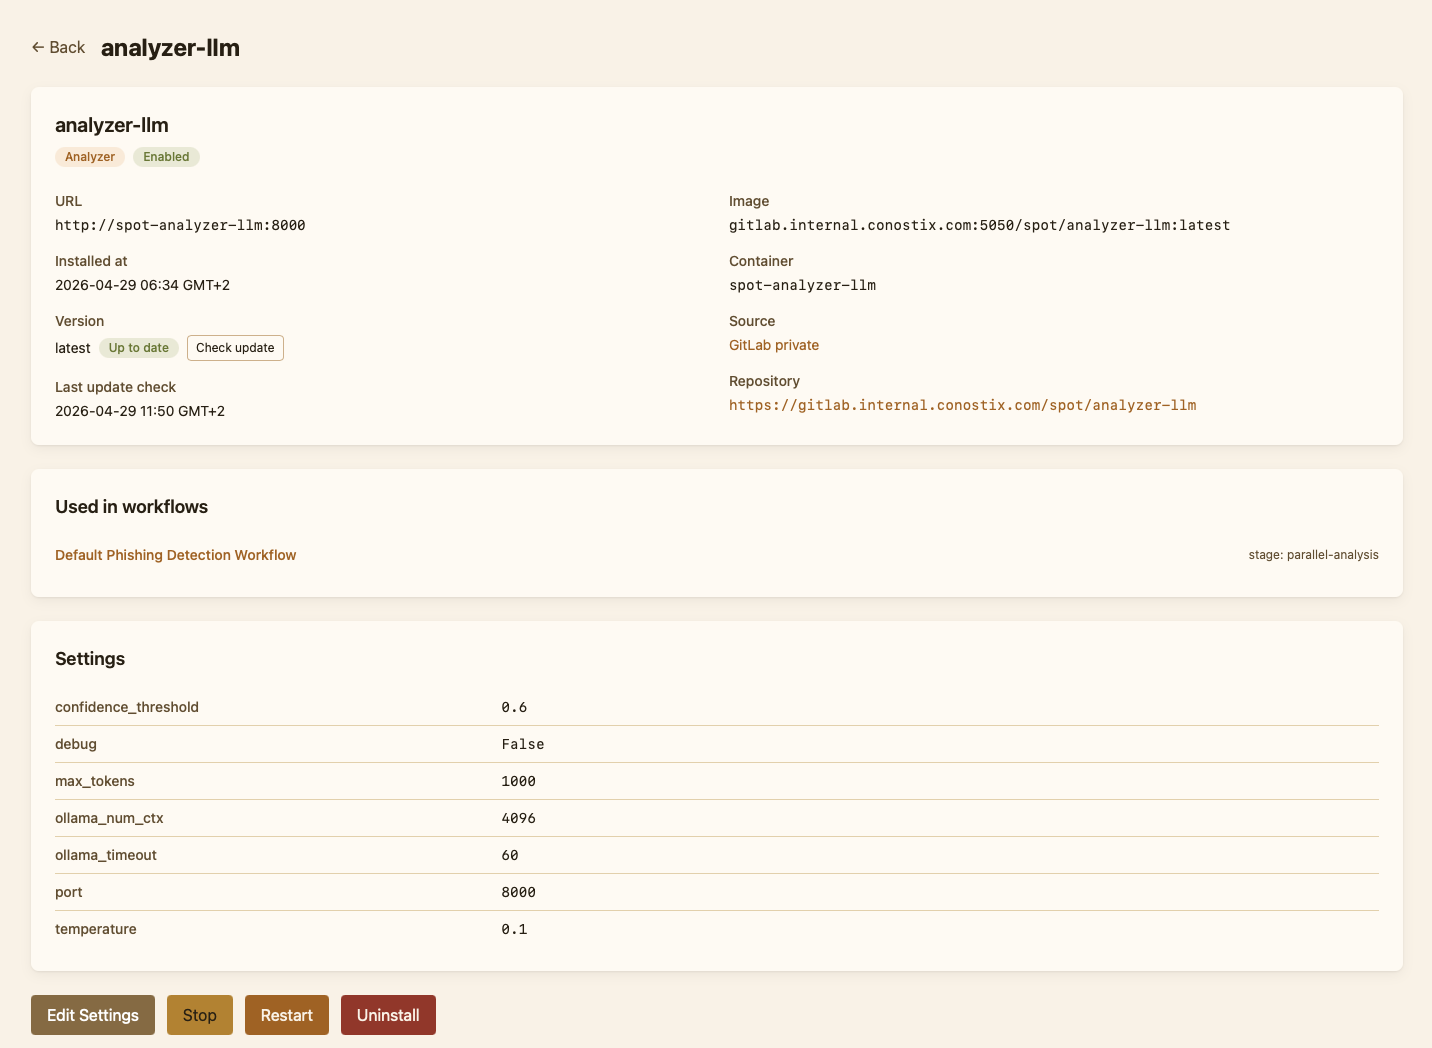
To install a plugin, find it in the catalog, open its detail page, and click Install. SPOT pulls the container, registers the plugin in its configuration, applies any default settings the plugin shipped, and starts it. The plugin shows up under Installed with a status chip; the operator can edit settings, restart, or uninstall from there.
Updates work the same way. From the Catalog or the plugin's Installed detail page, click Check update to ask SPOT to re-scan the source for a newer version. If one is available, an "Update available" chip appears next to the version, and the operator can apply it from the same page.
Inspecting the knowledge store
When an analyzer's verdict depends on organisational context, the knowledge store is the place to verify what it saw. Open Knowledge in the dashboard. The most useful operations are:
- Filter by source. Narrow the view to one provider so you can confirm its sync delivered what you expected.
- Filter by tag expression.
executive+financeshows you the documents that an analyzer would consult for a finance-themed message about an executive. - Run a semantic query. Paste the text from a flagged message into the query box and see what the analyzer would see.
If the documents look wrong, the issue is upstream: open the provider's detail page, check the last sync time, look at any errors, and trigger a manual sync if needed. If the documents look right but the analyzer still got it wrong, the issue is in the analyzer ; open its settings, or open the analysis to see what queries the analyzer actually ran.
When something is broken
Two pages catch most operational issues before they become emergencies:
- Health. Each SPOT service appears with a status. A red row is the first thing to investigate; expanding it reveals the last error and the time it happened.
- Queues. Backlogs show up here before they show up anywhere else. A queue with a steadily-growing depth means something downstream is slow or stuck.
If the queues are clean and Health is green but analyses still feel wrong, the issue is more likely in a workflow or a plugin's settings than in the platform itself.
Day-zero checklist
A short routine for someone who is new to SPOT and wants to know that things are working:
- Open Health. Every row should be green. Note the last-ingestion timestamp.
- Open Analysis. Recent rows should be present, and a mix of verdicts should look plausible.
- Open Plugins. The Installed list should match what the admin guide expected for this deployment; everything should be running.
- Open Knowledge. The total count should be non-zero, and filtering by each source should return documents.
- Submit one known-bad email through the Submit form and confirm SPOT classifies it as expected.
If all five pass, the platform is operational and the operator can start working from the Analysis page.